TL;DR:
- Commercial facilities often have significant invisible water and energy waste impacting costs and ESG reporting.
- Reliable data collection from utility bills, smart meters, and IoT sensors is essential for effective management.
- Unified tracking systems enable proactive detection, compliance, and continuous improvement through integrated workflows.
Commercial facilities that lack structured water and energy tracking routinely absorb losses they cannot see. After-hours waste alone can reach 40 to 50% of peak consumption, while a single faulty toilet may silently drain 200 gallons per day. For facility managers and sustainability officers, these invisible losses translate directly into inflated operating costs and ESG reporting gaps. This guide walks you through a proven, stepwise workflow: from gathering reliable data and performing structured audits, to integrating automated systems and meeting disclosure requirements. Each phase builds on the last, giving you a clear path from reactive management to measurable, reportable efficiency.
Table of Contents
- Gathering accurate water and energy usage data
- Performing robust water and energy audits
- Integrating advanced tracking and control systems
- Addressing compliance and optimizing for ESG disclosure
- The uncomfortable truth about tracking workflows
- Transform your tracking workflow for sustainable success
- Frequently asked questions
Key Takeaways
| Point | Details |
|---|---|
| Start with reliable data | Accurate water and energy tracking begins by collecting data from utility bills, smart meters, and IoT sensors. |
| Structured audits uncover waste | Systematic audits using recognized standards help identify leaks, inefficiencies, and energy waste. |
| Unified tracking supports compliance | Integrating data and workflows ensures regulatory compliance and simplifies ESG reporting. |
| Continuous vigilance drives savings | Regular monitoring and workflow discipline are more effective than relying solely on technology. |
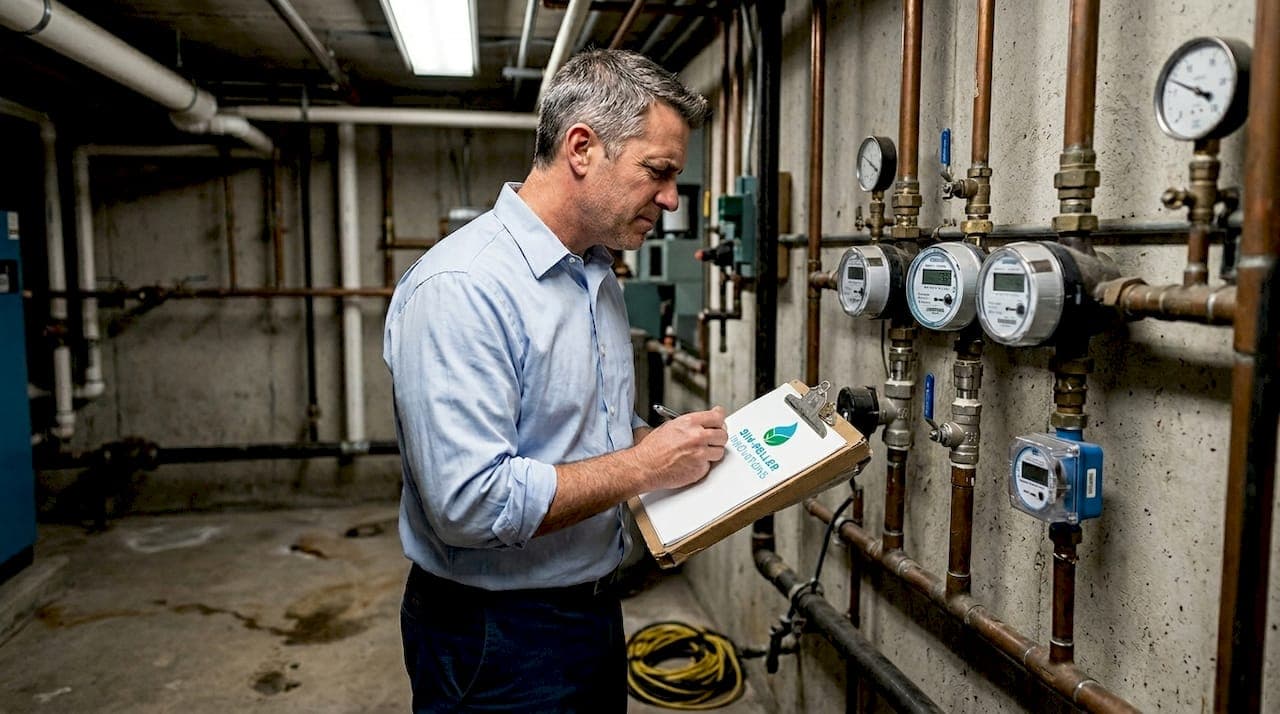
Gathering accurate water and energy usage data
With the groundwork set, the first step is obtaining reliable consumption data. You cannot manage what you cannot measure, and in commercial real estate, measurement quality determines everything that follows.
Tracking workflows typically begin with three primary sources: utility bills, smart meters, and IoT sensors for real-time monitoring of consumption patterns. Each source has a different resolution and reliability profile, and the best programs use all three in combination.
![]()
Primary data sources compared
| Source | Resolution | Best use case |
|---|---|---|
| Utility bills | Monthly | Baseline benchmarking |
| Smart meters | Hourly/daily | Trend detection |
| IoT sensors | Real-time | Leak and anomaly alerts |
Utility bills give you the long view, useful for year-over-year benchmarking and budget forecasting. Smart meters sharpen that picture to hourly or daily intervals, making it possible to spot demand spikes tied to specific operations or tenant behavior. IoT sensors go further still, capturing real-time flow data at the fixture or zone level so that gradual leaks and after-hours waste become visible before they compound.
Normalizing your data is just as important as collecting it. Raw consumption numbers mean little without context. You need to adjust for building size (expressed as energy use intensity, or EUI, per square foot), occupancy rates, and local weather conditions. A spike in water use during a heat wave looks very different from the same spike in mild weather. Normalization lets you compare performance across time periods and against industry benchmarks without distortion.
Here is a practical sequence for building your data foundation:
- Pull 24 months of utility bills to establish a reliable consumption baseline
- Confirm meter accuracy by cross-referencing utility reads with on-site sub-meter data
- Install IoT sensors at high-use zones: restrooms, cooling towers, irrigation, and kitchens
- Set automated alerts for consumption that exceeds predefined thresholds
- Normalize all data by occupied square footage and degree days before analysis
Pro Tip: Prioritize primary meter data over estimates at every stage. Estimated reads from utilities introduce errors that compound over time, skewing your baseline and undermining audit accuracy. If your utility provides estimated bills, flag those months and request actual reads.
For teams building out their sensor infrastructure, the IoT workflow guide covers device selection and placement in detail. Understanding smart water management principles also helps teams prioritize which data streams deliver the most actionable signal.
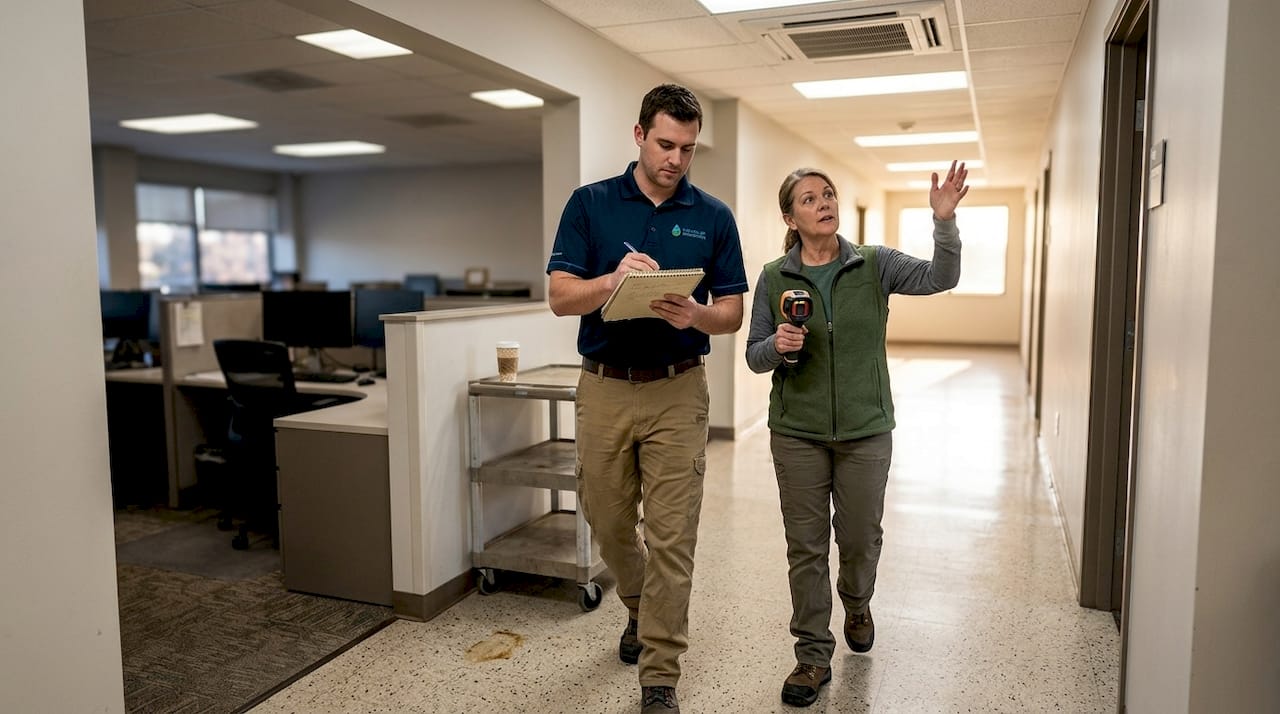
Performing robust water and energy audits
Once you have reliable data, structured audits pinpoint inefficiencies and loss. Data collection tells you what is happening. Audits tell you why and where.
Key methodologies include water audits using IWA/AWWA standards with three levels, ranging from a basic walkthrough to detailed water balance modeling, alongside energy audits structured to ASHRAE levels. Each level demands more time and investment but returns proportionally deeper insight.
Audit levels at a glance
| Level | Scope | Output |
|---|---|---|
| Level 1 (walkthrough) | Visual inspection, bill review | Preliminary loss estimates |
| Level 2 (survey) | Metered measurements, system checks | Quantified inefficiencies |
| Level 3 (investment-grade) | Full modeling, financial analysis | Capital project justification |
Water balance calculations are the core analytical tool at Level 2 and above. You take total authorized consumption, subtract metered use, and what remains is non-revenue water: leaks, meter error, and unauthorized use. After-hours waste patterns and gradual fixture leaks are consistently among the largest contributors, yet they rarely appear on a utility bill as a discrete line item.
For multi-tenant commercial properties, zone-level submetering is essential. Without it, you cannot isolate which tenant or system is driving consumption, making cost recovery and targeted retrofits nearly impossible.
A structured audit sequence looks like this:
- Review 24 months of normalized utility data to identify anomalies
- Conduct a Level 1 walkthrough to prioritize high-loss systems
- Deploy temporary or permanent sub-meters at suspect zones
- Perform water balance calculations to quantify non-revenue water
- Complete a Level 2 or 3 audit for systems where losses exceed threshold
- Document findings in a format compatible with your ESG reporting framework
Pro Tip: Schedule at least one after-hours audit session. Many facilities discover that HVAC systems and irrigation run long past occupancy, accounting for a disproportionate share of total consumption. Night-time readings often reveal the losses that daytime walkthroughs miss entirely.
For teams evaluating retrofit options post-audit, reviewing energy-saving devices tailored to commercial facilities helps prioritize capital allocation based on audit findings.
Integrating advanced tracking and control systems
After identifying inefficiencies through audits, the next phase is automating and synchronizing your tracking workflow. Manual data collection does not scale, and fragmented tools create reporting blind spots that undermine both operational decisions and ESG disclosures.
The foundation of an integrated system is your building management system, or BMS. A BMS consolidates control of HVAC, lighting, and in many cases water systems into a single interface. When you connect IoT sensors and edge devices to your BMS, you gain the ability to automate responses: shutting off irrigation during rain events, flagging anomalous flow rates at 2 a.m., or throttling cooling tower makeup water based on real-time occupancy data.
Unified platforms are strongly preferred over fragmented tool sets, particularly for facilities with ESG and compliance obligations. Fragmented approaches, where water data lives in one system, energy in another, and reporting in a third, create reconciliation overhead and increase the risk of disclosure errors.
Key integration priorities for commercial facilities:
- Connect all sub-meters and IoT sensors to a centralized data platform
- Establish automated alerts for leak detection, demand spikes, and after-hours anomalies
- Integrate with your BMS to enable automated control responses, not just monitoring
- Ensure your platform exports data in formats compatible with GRESB, ENERGY STAR Portfolio Manager, and your internal ESG reporting tools
- Build in redundancy: edge devices should log locally in case of connectivity loss
Pro Tip: When evaluating platforms, ask vendors specifically how they handle data normalization and how their output maps to GRESB and ENERGY STAR reporting fields. A platform that requires manual reformatting before every disclosure cycle will cost you more in staff time than it saves in monitoring efficiency.
For teams assessing how IoT integration changes the operational picture in practice, the sustainable architecture solutions resource covers real-world deployment scenarios across building types. The IoT workflow guide also provides a detailed integration checklist for teams at different stages of maturity.
Addressing compliance and optimizing for ESG disclosure
Integrated systems are powerful, but a unified workflow is essential for regulatory compliance and ESG performance. Tracking technology is only as valuable as the reporting it enables.
The regulatory environment for commercial buildings is tightening. EPA WaterSense and local building performance standards now mandate audits and benchmarking in an increasing number of jurisdictions, with penalties for non-compliance and incentives for top performers. Facilities that have already built unified tracking workflows are positioned to meet these requirements with minimal additional effort.
"Unified tracking is not just a compliance tool. It is a strategic asset that lets you demonstrate verified performance improvements to investors, tenants, and regulators, on demand."
Key compliance and disclosure priorities:
- Benchmark annually through ENERGY STAR Portfolio Manager and submit scores where required by local BPS mandates
- Align water and energy data collection with ESG water reuse strategies to support GRESB and TCFD disclosures
- Use audit findings to set science-based reduction targets and track progress year over year
- Review ESRS2 sustainability requirements to ensure your reporting framework covers material water and energy risks
- Convert verified efficiency gains into performance-based rewards that support both cost recovery and ESG narrative
Looking ahead, net-zero commitments from major tenants and institutional investors are making granular, auditable resource data a lease negotiation factor, not just a reporting checkbox. Facilities that invest in unified tracking now are building the data infrastructure that will define asset value in the next decade.
The uncomfortable truth about tracking workflows
Beyond integration and compliance, there is a deeper lesson every facility manager should understand. Most water and energy tracking programs fail not because of inadequate technology, but because of inadequate workflow discipline.
A sensor network without a defined response protocol is just expensive data. Unified platforms are most effective when paired with clear ownership: someone accountable for reviewing alerts, escalating anomalies, and closing the loop on identified losses. Without that human layer, even the best-integrated system becomes background noise.
One-time audits are similarly limited. A Level 3 audit conducted today will be partially obsolete within 18 months as occupancy patterns shift, equipment ages, and tenant loads change. Continuous monitoring, reviewed on a defined cadence, consistently outperforms periodic deep-dives in catching losses early.
The facilities that achieve the steepest efficiency curves share one trait: cross-team accountability. Engineering, finance, and sustainability officers review the same data together. Savings targets are shared, not siloed. If you want to know how to build that discipline systematically, the cut water costs guide offers a practical framework for cross-functional tracking governance.
Transform your tracking workflow for sustainable success
Ready to move from fragmented data to a unified, ESG-ready tracking operation? Simpeller's plug-and-play smartsink IoT sensors and AI-driven platform make invisible water and energy waste visible across your entire portfolio. Our system integrates with existing BMS infrastructure, normalizes data automatically, and converts verified efficiency gains into measurable value, whether that means renewable PV credits, material-exchange vouchers, or cross-subsidy contributions for underserved communities. Simpeller's unified tracking platform gives facility managers and sustainability officers the tools to track, report, and act, without rebuilding your existing systems from scratch. Start turning every drop into a documented saving.
Frequently asked questions
What is the first step in setting up a water and energy tracking workflow?
The first step is collecting accurate data from utility bills, smart meters, and IoT sensors to establish a reliable consumption baseline before any audit or optimization work begins.
How can facility managers identify hidden losses or inefficiencies?
Managers should conduct structured audits using IWA/AWWA and ASHRAE standards, then perform water balance calculations to quantify non-revenue water from leaks, meter inaccuracies, and after-hours waste.
Why is unified tracking software preferred for ESG reporting?
Unified platforms eliminate reconciliation gaps between siloed data sources, making it straightforward to produce auditable disclosures for GRESB, ENERGY STAR, and net-zero reporting frameworks without manual reformatting.
Are IoT devices necessary for effective tracking in commercial real estate?
IoT sensors provide real-time granular flow data at the fixture and zone level, enabling leak detection and anomaly alerts that monthly utility bills and manual walkthroughs consistently miss.