TL;DR:
- Untracked water waste in commercial buildings leads to significant financial and environmental costs.
- Implementing submeters and real-time monitoring enables early leak detection and efficiency optimization.
- Regular data review, integration, and accountability are crucial for turning insights into measurable water savings.
Untracked water waste is costing commercial facilities far more than most realize. A single undetected leak in a mid-size office building can silently drain tens of thousands of dollars annually, all while inflating your carbon footprint and undermining ESG commitments. US commercial properties lose massive volumes from undetected water leaks every year. For facility managers and sustainability executives, this is not just a maintenance headache. It is a measurable liability. This guide walks you through a proven, step-by-step process to baseline, monitor, detect, verify, and continuously improve your building's water performance from the ground up.
Table of Contents
- Assess current water use and set goals
- Select and implement metering solutions
- Monitor, detect, and respond to leaks and anomalies
- Review, verify, and continuously optimize usage
- Why real value comes from integration and action, not just data
- Take your water tracking to the next level
- Frequently asked questions
Key Takeaways
| Point | Details |
|---|---|
| Submetering is essential | Installing submeters for high-use areas allows detailed tracking, cost allocation, and big savings. |
| Smart monitoring prevents loss | Real-time analytics enable early leak detection and stop waste before it impacts the bottom line. |
| Verify and continually improve | Frequent reviews, calibrations, and upgrades drive sustained water and cost reductions over time. |
| Integration multiplies impact | Connecting meters to building management and accountability systems turns data into real results. |
Assess current water use and set goals
With the true costs of untracked water clear, the first step is understanding your building's baseline consumption and aligning efforts to measurable targets.
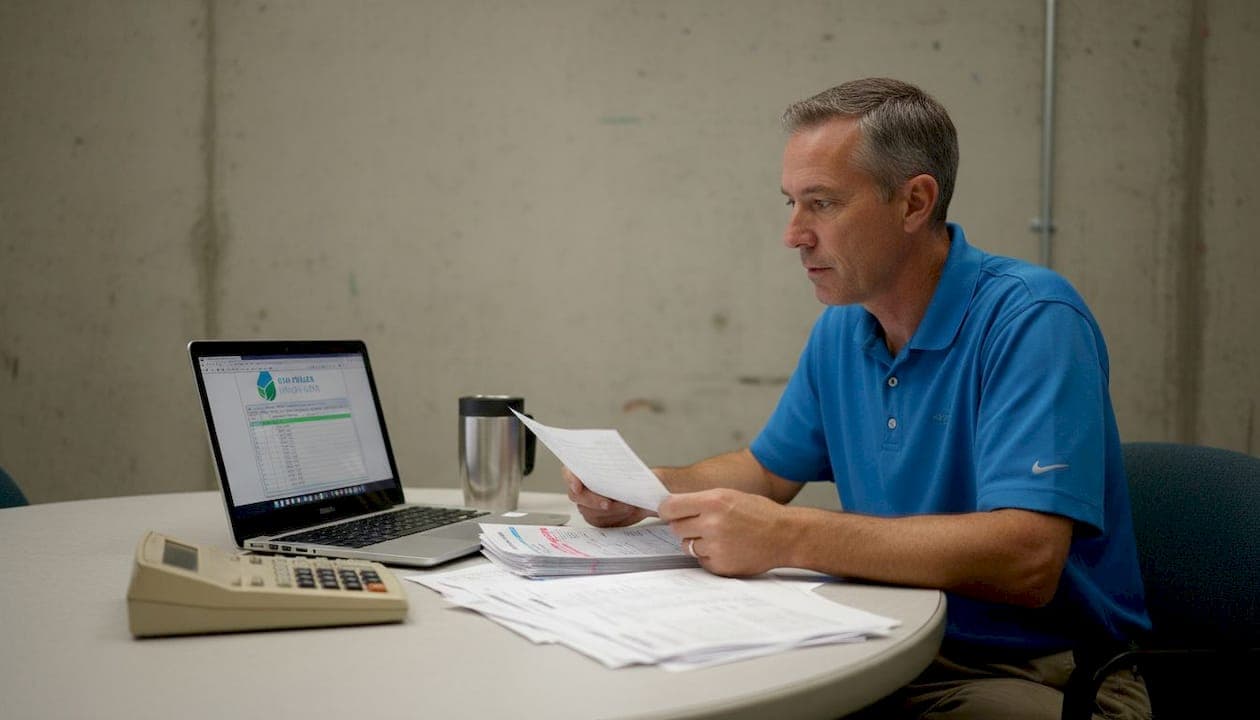
Start with a water baseline audit. Pull utility bills from the past 12 months and log meter readings by week. This gives you a consumption curve that reveals seasonal spikes, unusual patterns, and high-use periods you may not have noticed before. Pair this data with a walkthrough of the facility to identify the primary water-consuming systems: restrooms, cooling towers, irrigation, kitchen operations, and any process water loops.
![]()
Once you know where water goes, align your targets to a water savings guide that connects conservation milestones to both financial return and ESG reporting. Setting SMART goals, Specific, Measurable, Achievable, Relevant, and Time-bound, gives your efforts structure. For example, a target to reduce restroom water use by 10% in six months is trackable, motivating, and auditable for sustainability reports.
Benchmarking is equally important. Federal facilities with 200 employees can use up to 3,000 gallons per day, and submetering alone can cut usage by 15 to 40%. Use EPA WaterSense and federal benchmarks to understand where your property sits relative to industry norms. If your numbers are significantly above average, that gap is your opportunity.
Sample daily water use by area (gallons per person)
| Area | Low estimate | High estimate |
|---|---|---|
| Restrooms | 10 | 20 |
| Cooling towers | 5 | 15 |
| Kitchen and breakrooms | 3 | 8 |
| Irrigation (per 1,000 sqft) | 2 | 12 |
| Process or lab water | 5 | 30 |
Here is a straightforward process to set your tracking baseline:
- Collect 12 months of utility bills and identify peak-use months.
- Walk the facility to map every water-consuming fixture and system.
- Compare consumption against federal or EPA benchmarks.
- Set SMART conservation goals tied to financial and ESG outcomes.
- Assign ownership of each goal to a specific team or person.
For water reuse cuts in commercial real estate, baseline data is the foundation. Without it, you cannot measure progress or justify investment.
Pro Tip: Set up internal monthly tracking using a shared dashboard or simple spreadsheet. Anomalies caught early, such as a 20% spike in one week, often signal leaks or equipment failures before they become expensive problems.
Select and implement metering solutions
Once you know where your water goes, you can select the right technology to monitor it. Here is how to choose and deploy what works.
Not every building needs the same metering approach. A smaller office may manage well with a main meter and periodic manual reads. A large commercial facility with multiple tenants, cooling systems, and process water will need submetering key areas like cooling towers and restrooms to get granular, actionable data. Submetering allows you to isolate consumption by zone, tenant, or system, making it far easier to pinpoint waste and allocate costs fairly.
Smart meters go further, transmitting data in real time and integrating with Building Management Systems (BMS) for automated alerts and trend analysis. Following metering best practices means developing a comprehensive metering plan, ensuring real-time monitoring capability, scheduling regular calibration, and integrating meter data with your BMS for maximum analytical leverage.
Metering options compared
| Meter type | Best for | Key advantage | Limitation |
|---|---|---|---|
| Main meter | Small buildings | Low cost, simple | No zone detail |
| Submeters | Multi-tenant, complex | Granular, cost-allocable | Higher install cost |
| Smart meters | All sizes | Real-time alerts, analytics | Requires network infra |
An IoT and AI efficiency guide for facility managers details how connected sensors dramatically shorten the time from leak to response. When paired with smart water management platforms, meter data becomes predictive rather than just reactive.
For a successful rollout, you will need:
- Flow meters and submeters sized for each system
- IoT-enabled data loggers or smart meter hardware
- A software platform for data aggregation and visualization
- Network connectivity (Wi-Fi, LoRaWAN, or cellular)
- Clear documentation of meter locations and calibration schedules
Pro Tip: Pilot your metering rollout in the highest-risk or highest-cost areas first, such as cooling towers or large restroom blocks. You will get faster ROI, resolve installation issues early, and build the internal case for expanding the program.
Monitor, detect, and respond to leaks and anomalies
Wired for real-time data, the facility's next challenge is rapid leak identification and automated response. Here is what works in the field.
Continuous monitoring is where the investment pays off. Smart meters transmit consumption data at intervals as short as every 15 minutes. Analytics platforms compare this data against your established baseline and flag deviations automatically. A simple rule, alert the facilities team when any zone exceeds 15% above its 7-day average, can catch a running toilet, a failed seal, or a stuck valve before it becomes a four-figure repair.
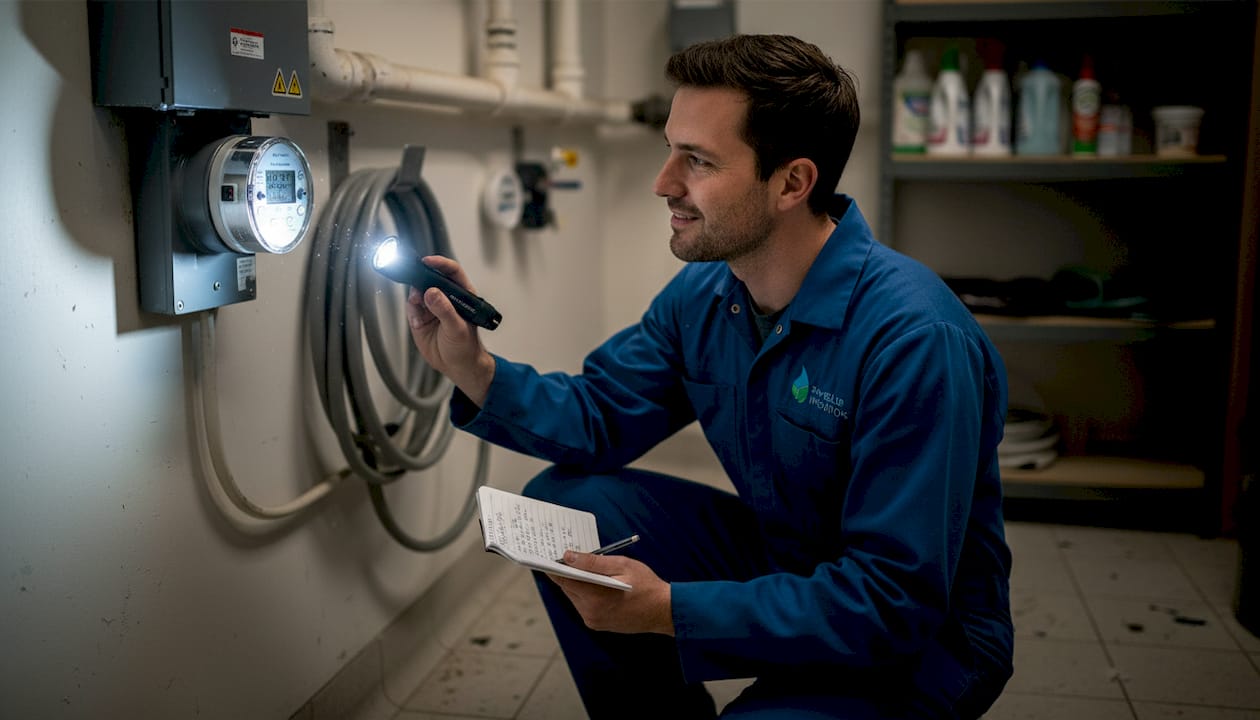
Leak detection technology varies by system size and complexity. Noise loggers are ideal for small distribution pipes, picking up acoustic signatures of leaks that no visual inspection would catch. In-pipe sensors work best for larger diameter mains, providing flow and pressure readings that signal a breach. Smart metering enables early leak detection through usage anomalies, saving billions of gallons annually across US facilities.
Commercial buildings that deploy real-time monitoring and anomaly detection typically recover their technology investment within 12 to 18 months, driven by reduced utility bills, avoided repair costs, and lower insurance risk. Proactive monitoring is not just an operational advantage. It is a financial strategy.
Use AI-driven water analytics to move from manual checks to automated intelligence. AI models can learn your facility's consumption fingerprint, accounting for occupancy patterns, weather, and seasonal shifts, making alerts more accurate and reducing false positives that cause alert fatigue.
When an anomaly is detected, follow this response sequence:
- Receive automated alert from monitoring platform.
- Cross-check alert against occupancy schedule and recent maintenance logs.
- Dispatch technician to the flagged zone within your response SLA.
- Identify source: fixture, pipe, valve, or equipment failure.
- Execute repair and document the root cause.
- Verify restoration by confirming consumption returns to baseline.
- Log the incident for future audit and pattern analysis.
To optimize water monitoring workflow, build this response process into your facility's standard operating procedures. Speed matters. Every day a leak runs undetected is money and water you will not recover.
Review, verify, and continuously optimize usage
A system is only as good as its feedback. Here is how to turn collected data into measurable, lasting results.
Data without regular review is just noise. Build a structured review cycle: monthly for anomaly trends, quarterly for full meter audits, and annually for fixture-level assessments. Regular calibration, data audits, and conservation upgrades are best practices that amplify results over time. A meter that drifts 5% from accuracy does not just give you bad data. It undermines every saving you are trying to track and report.
Periodic water audits should go beyond meter data. Walk the facility with a fixture checklist: aerators, flush valves, cooling tower bleed-off rates, and irrigation controllers. Combine submetering with fixture retrofits and water audits for the highest net operating income (NOI) impact. A high-efficiency fixture retrofit combined with verified submeter savings can meaningfully strengthen your property's financial profile.
Meter data is also your proof layer for third-party certifications. LEED, ENERGY STAR, and federal mandates all require documented consumption data and verified savings. Without a robust metering and review process, these credentials are impossible to earn and difficult to maintain.
Here are the key tactics for water monitoring for sustainable architecture and ongoing optimization:
- Share monthly usage data with building stakeholders and tenants
- Run annual water audits with a certified professional
- Schedule quarterly meter calibration checks
- Track fixture retrofit outcomes against pre-retrofit submeter baselines
- Use savings data to build the ROI case for future capital projects
- Align reporting cycles with LEED or ENERGY STAR submission timelines
- Explore onsite water recycling to push efficiency further
Pro Tip: Segment your verified savings by zone using submeter data. When you can show that restroom retrofits saved 120,000 gallons and $1,400 in six months, you have a compelling, data-backed case to replicate that investment in every restroom block across the portfolio.
Why real value comes from integration and action, not just data
With a complete loop established, it is important to understand where well-intended tracking efforts often fall short and how to turn information into ROI.
Many facilities install meters and consider the job done. The dashboard gets set up, the data flows, and then nothing changes. This is one of the most common and costly mistakes in commercial water management. Fancy dashboards without accountability structures produce zero savings. The meter is not the solution. The system around it is.
Real results come when metering integrates with BMS, when alerts trigger defined responses, and when consumption data connects to performance-based water rewards that motivate behavior change across your team. Tie water efficiency metrics to facilities team KPIs. Run quarterly conservation challenges. Share wins publicly with tenants and stakeholders.
We have seen it repeatedly: the buildings that save the most water are not those with the most sophisticated meters. They are the ones where someone is accountable for acting on what the meters reveal. Integration and accountability are the multipliers that turn data into dollars.
Take your water tracking to the next level
Ready to capture every water and cost saving opportunity? Here is how to get support that delivers results.
Simpeller helps facility managers and sustainability executives put everything covered in this guide into practice, without the complexity of stitching together separate systems. Our plug-and-play smartsink IoT devices and AI-driven platform make water waste visible in real time, connecting directly to your BMS for seamless analytics and automated alerts. From baseline auditing to continuous optimization, Simpeller's water solutions give you the verified performance data needed to reduce operational costs, support LEED and ESG reporting, and convert efficiency gains into measurable value. Book a consultation today to see how Simpeller turns your facility's water data into lasting savings.
Frequently asked questions
What is the best way to track water usage in a large commercial building?
The best method is combining submetering with smart meters and analytics software for real-time, zone-level monitoring and granular cost allocation across tenants and systems.
How much can submetering reduce water consumption?
Submetering cuts total water use by 15 to 40%, offsetting installation costs quickly and delivering measurable improvements to net operating income.
How do smart meters improve leak detection?
Smart meters use real-time usage data to identify consumption anomalies automatically, alerting facility teams before small leaks become large, expensive failures.
What other steps boost water efficiency after tracking starts?
Combining tracking with fixture retrofits and audits produces the highest efficiency gains, especially when submeter data verifies the before-and-after impact of each improvement.
How does water tracking support ESG and compliance?
Accurate submeter data provides documented proof for LEED, ENERGY STAR, and federal mandates, giving sustainability executives verified figures for ESG reporting and carbon accounting.