TL;DR:
- Water data analytics can reduce water use by up to 40 percent.
- Challenges include sensor drift, data quality issues, and cybersecurity risks.
- Successful implementation relies on disciplined pilots, multiple data sources, and organizational trust.
Water utility managers and operations leaders have long assumed that squeezing an extra 10% out of consumption is a win worth celebrating. The reality is far more ambitious. Empirical benchmarks show water data analytics delivering 20 to 40% reductions in building water use, 2 billion liters saved annually at Melbourne Water, and over $100,000 per year in energy cost avoidance at a single wastewater treatment plant. This guide breaks down the technology, the verified results, the real pitfalls, and the implementation strategies that separate organizations getting transformative outcomes from those still reading dashboards and doing nothing with them.
Table of Contents
- What is water data analytics?
- Tangible impact: Data-driven water and energy savings
- Navigating challenges: What most guides don't tell you
- Maximizing long-term value: Best practices for implementation
- Beyond the hype: The uncomfortable truth about water data analytics
- Put analytics to work for your water management goals
- Frequently asked questions
Key Takeaways
| Point | Details |
|---|---|
| Proven efficiency gains | Water data analytics delivers double-digit savings in both water and energy use for organizations. |
| Cutting-edge technologies | IoT sensors, AI/ML, digital twins, and data fusion are driving real change in operational water management. |
| Practical challenges remain | Success requires tackling sensor drift, data gaps, and integrating explainable, secure analytics systems. |
| Start small but plan ahead | Piloting and standardizing data help ensure long-term ROI and smooth scaling of analytics initiatives. |
What is water data analytics?
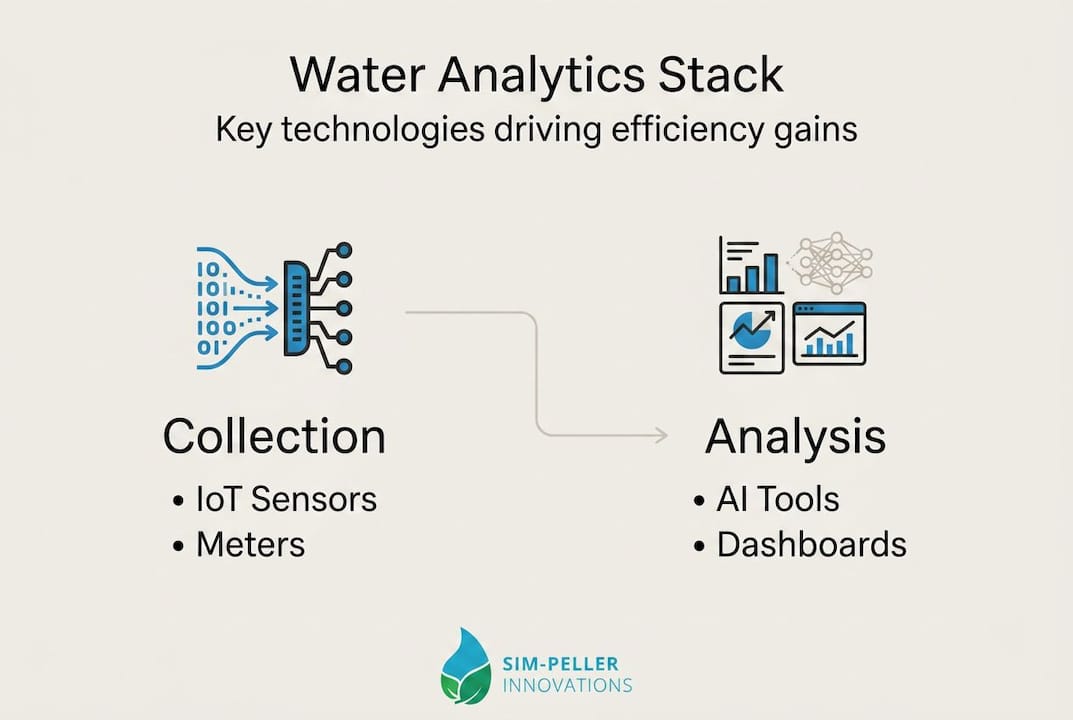
Water data analytics is the practice of collecting, processing, and interpreting data from water systems to improve how those systems perform. At its core, it turns raw flow rates, pressure readings, quality measurements, and consumption logs into decisions: where to fix a leak, when to adjust pump speed, how to reduce chemical dosing, and which assets need attention before they fail.
The term covers a broad stack of technologies working together. Core methodologies include IoT sensors for continuous data collection, AI and machine learning algorithms such as LSTM networks, XGBoost, and ANFIS for pattern recognition and forecasting, digital twins for virtual simulation of physical infrastructure, big data analytics platforms for processing high-volume streams, and hydraulic modeling tools like EPANET for network analysis. Each layer adds a different kind of intelligence to the system.
For operations managers, this matters practically. IoT and AI in facility water management enables real-time leak detection that no manual inspection schedule can match. Sensors log pressure anomalies at millisecond intervals, and machine learning models flag deviations that indicate a burst pipe before visible damage occurs. For sustainability officers, AI-driven water analytics connects consumption data to ESG reporting, giving you defensible, audited numbers for greenhouse gas accounting and water stewardship disclosures.
Here is how core tools map to outcomes in practice:
| Tool | Primary function | Operational outcome |
|---|---|---|
| IoT sensors | Real-time data collection | Continuous leak and waste detection |
| AI/ML algorithms | Pattern recognition and forecasting | Predictive maintenance and demand planning |
| Digital twins | Virtual system simulation | Scenario modeling before capital investment |
| Big data platforms | High-volume data processing | Trend analysis across large infrastructure |
| Hydraulic modeling (EPANET) | Network flow simulation | Pressure zone optimization |
The key benefits that IoT-based water monitoring delivers across these methodologies include:
- Continuous monitoring across distributed assets without manual site visits
- Predictive maintenance that reduces emergency repair costs and system downtime
- Demand forecasting that aligns supply with actual consumption patterns
- Energy optimization by matching pump operations to real-time system conditions
- Automated reporting that feeds directly into ESG and regulatory compliance workflows
What makes analytics genuinely different from older monitoring approaches is the closed loop between data collection and decision-making. Traditional SCADA systems logged data for human review. Modern analytics platforms interpret that data automatically, surface actionable alerts, and increasingly automate corrective responses without waiting for someone to read a report.
Tangible impact: Data-driven water and energy savings
Seeing the numbers laid out across real projects removes the abstraction from the conversation. These are not vendor projections. They are operational results from utilities and facilities that deployed analytics at scale.
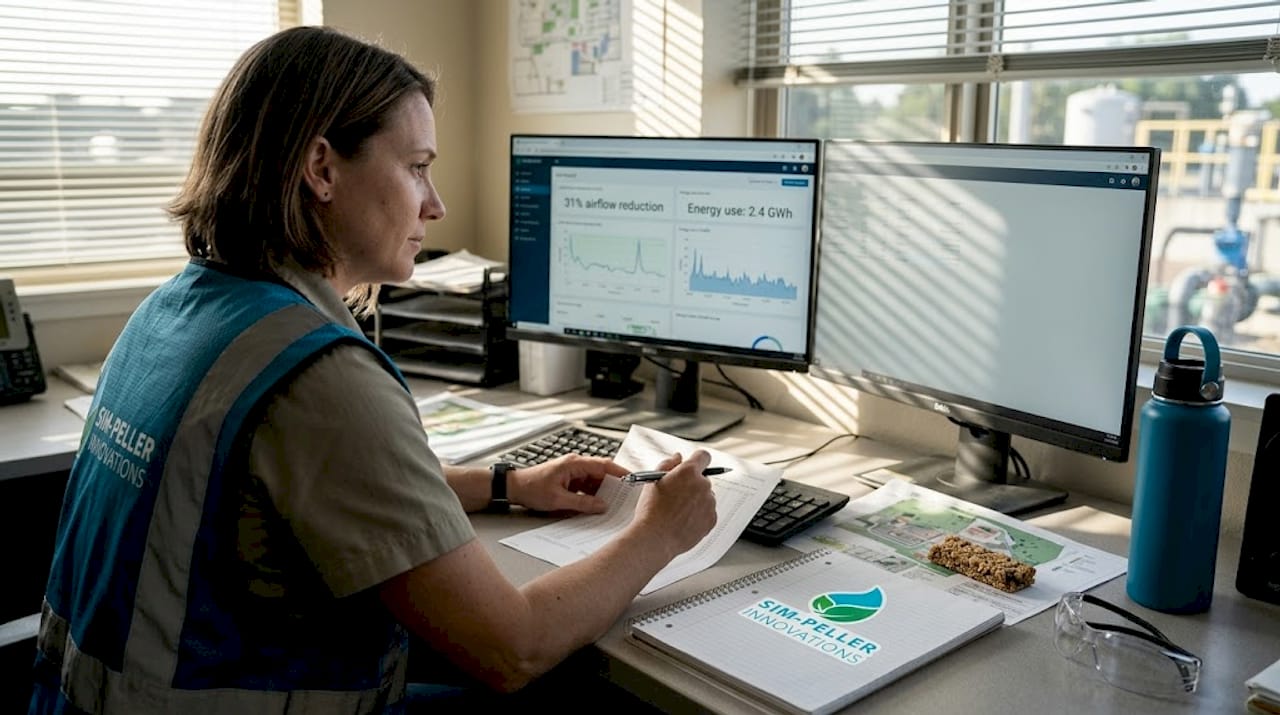
EMWD Wastewater Treatment Plant implemented AI-driven process control and achieved a 31% reduction in airflow, saving 2,330 kWh per day and generating over $100,000 annually in energy cost avoidance. That single facility result demonstrates how analytics applied to energy-intensive treatment processes compounds savings across both water and electricity budgets simultaneously.
Melbourne Water deployed model predictive control across its network and achieved savings of 2 billion liters per year while cutting chemical use and reducing operational variability. The project illustrated how demand forecasting, when connected to real infrastructure control, moves beyond reporting and into active resource management.
New York City DEP applied analytics to its treatment operations and achieved a 21% reduction in energy intensity alongside 8,700 tCO2e per year in emissions reductions. For sustainability officers managing Scope 1 and Scope 2 inventories, that kind of verified, asset-level emissions data is exactly what credible ESG reporting requires.
Las Vegas Valley Water District used analytics to target non-revenue water, achieving an 18% reduction in NRW, recovering millions of liters that were previously lost to undetected leakage.
Here is how these outcomes compare across dimensions relevant to your planning:
| Organization | Water savings | Energy savings | Emissions reduction | Payback period |
|---|---|---|---|---|
| EMWD WWTP | Significant process reduction | 2,330 kWh/day, $100k/year | Substantial | 14 to 22 months |
| Melbourne Water | 2 billion liters/year | Reduced chemical energy | Moderate | Short to medium term |
| NYC DEP | Process efficiency gains | 21% energy intensity cut | 8,700 tCO2e/year | Medium term |
| Las Vegas VVWD | 18% NRW reduction | Operational savings | Indirect reduction | Variable |
"Hybrid AI-digital twin systems targeting 15 to 30% efficiency gains with payback periods of 14 to 22 months represent the most credible near-term ROI opportunity for utilities and large industrial water users."
To move from case study to your own results, follow this sequence:
- Audit current data infrastructure to understand what sensors and meters are already in place and what gaps exist in coverage.
- Define priority use cases based on where your highest water and energy costs are concentrated, not where data is most available.
- Run a focused pilot on a single process or zone, using A/B comparisons to measure impact against a control baseline.
- Select analytics tools aligned with your existing operational technology stack to avoid integration friction.
- Establish ROI metrics upfront, including water volume, energy cost, emissions, and maintenance spend, so results are measurable and reportable.
Connecting these results to structured water savings strategies and performance-based water rewards creates a system where efficiency gains translate directly into financial and ESG value. For organizations with sustainability commitments, water monitoring for sustainable architecture is increasingly a design requirement, not an afterthought.
Navigating challenges: What most guides don't tell you
Every vendor presentation will tell you what analytics can do at its best. Far fewer will walk you through what goes wrong in practice. The gap between projected and realized savings usually traces back to a handful of predictable failure modes.
The most common technical issues operations teams encounter include:
- Sensor drift and biofouling: Flow meters and water quality sensors degrade over time, especially in harsh treatment environments. Without calibration schedules and drift detection algorithms, the data feeding your AI models gradually becomes unreliable.
- Data gaps and concept drift: Sensor failures, communication dropouts, and seasonal shifts in system behavior cause models trained on historical data to lose accuracy. This is called concept drift, and it is one of the least-discussed risks in analytics deployments.
- High initial costs and interoperability issues: Retrofitting legacy infrastructure with modern sensors and connecting them to cloud analytics platforms often costs more and takes longer than initial scopes suggest.
- Cybersecurity exposure: Water infrastructure connected to networks faces real threats, including sensor spoofing and denial-of-service attacks that can manipulate control systems or mask leaks from detection.
- Scalability limits: A pilot that works beautifully across one pressure zone may not scale cleanly to an entire network without significant re-engineering.
The data quality problem deserves particular attention. Poor data quality produces the "garbage in, garbage out" failure that undermines even sophisticated AI systems. Large language models applied to water data carry additional risks, including hallucinations and embedded biases that can produce confident-sounding but incorrect operational recommendations. Explainable AI, where the model shows its reasoning rather than just its output, is not optional for safety-critical water infrastructure.
The need for auditable, explainable systems connects directly to regulatory risk. Analytics outputs that cannot be traced to verifiable data and transparent logic create compliance exposure when regulators or auditors ask how decisions were made.
Pro Tip: Before selecting any analytics platform, require vendors to demonstrate how their system handles missing data, sensor failures, and model retraining schedules. A platform with no clear answer to those three questions is not production-ready for your infrastructure.
Smart water management strategies that address these challenges combine robust data governance with technical implementation, treating data quality as infrastructure in its own right, not a software feature.
Maximizing long-term value: Best practices for implementation
Understanding what fails in poorly designed analytics programs gives you a clear map for designing one that works. The organizations that consistently achieve the top end of efficiency gains share a set of implementation disciplines that go beyond choosing the right software.
Follow this structured approach to build an analytics initiative that compounds value over time:
- Start with a contained, high-impact pilot: Choose a zone or process where baseline data is already reasonably clean and where a meaningful efficiency opportunity exists. A/B testing traditional proportional-integral-derivative (PID) control against AI-driven predictive control in the same facility gives you a credible comparison before committing to broader rollout.
- Integrate multiple data sources from the start: Single-sensor analytics are fragile. Fusing data from flow meters, pressure transducers, weather feeds, and energy meters creates a richer picture and reduces the impact of any single sensor failure.
- Prioritize metadata and data labeling: Every data point needs context: sensor ID, location, calibration date, data quality flag. Without metadata, your data lake becomes an unreliable archive that no model can use confidently.
- Standardize data formats across assets: Use open standards where possible to avoid vendor lock-in and to make future system integrations manageable.
- Plan for model maintenance: Analytics models degrade as systems change. Build retraining cycles and performance monitoring into your operational calendar, not just your initial deployment plan.
- Align analytics outputs with ESG and regulatory frameworks: Analytics for SDG6 compliance and greenhouse gas accounting requires that efficiency gains be verifiable and traceable. Design your data architecture to produce audit-ready outputs from day one, including reduced non-revenue water, leakage rates, and energy intensity metrics.
- Prefer explainable AI over black-box algorithms: For water infrastructure, where model errors can affect public health and regulatory compliance, models that show their reasoning are safer and more defensible than those that do not.
Future developments worth tracking include blockchain-secured water data audit trails that prevent tampering with performance records, standardized interoperability frameworks that allow analytics systems from different vendors to share data cleanly, and XAI (explainable artificial intelligence) tools that make complex model decisions readable by non-technical stakeholders.
Pro Tip: The fastest path to demonstrable ROI is combining quick-win leak detection with energy optimization on pumping systems. Both produce measurable financial results within weeks of deployment and create organizational confidence that supports the longer, more complex work of full-scale analytics integration.
Connecting analytics outcomes to onsite water recycling strategies and water reuse for ESG performance creates a layered efficiency program where analytics drives optimization and reuse systems reduce demand simultaneously.
Beyond the hype: The uncomfortable truth about water data analytics
Spend enough time working at the intersection of water infrastructure and data systems and a clear pattern emerges: the technology almost never fails in isolation. What fails is the organizational context around it.
Most guides focus on algorithm selection, sensor specifications, and integration architecture. They underestimate the weight of stakeholder buy-in, data culture, and long-term resilience planning. An analytics platform deployed into an organization where operations staff distrust automated alerts will generate reports that nobody acts on. A beautifully engineered digital twin that feeds into an ESG process no one owns will never close the loop between insight and outcome.
The genuine value of water data analytics lies not in the sophistication of its models but in the trustworthiness of its data and the organizational discipline to act on what that data reveals. Siloed systems, poorly maintained sensor networks, and unexplainable AI outputs are not technology problems. They are governance problems dressed in technical clothing.
Leaders who distinguish real impact from vendor hype invest first in foundational data governance: clear ownership, documented calibration schedules, standardized formats, and transparent model logic. Unlocking the full ROI of water analytics requires building the organizational infrastructure to use data well, not just the technical infrastructure to collect it.
Put analytics to work for your water management goals
The efficiency gains documented across EMWD, Melbourne Water, NYC DEP, and Las Vegas are not anomalies. They are repeatable outcomes for organizations that combine the right technology with disciplined implementation. At Simpeller, our plug-and-play IoT sensors and AI-driven platform make water and energy waste visible across facilities, giving operations managers and sustainability officers the verified data they need to reduce costs, meet ESG targets, and convert efficiency gains into measurable value. Explore our water-saving solutions to see how real-time monitoring, performance tracking, and tokenized efficiency rewards can work for your operations, and turn every liter saved into a quantified, reportable result.
Frequently asked questions
What is water data analytics in simple terms?
Water data analytics means collecting and analyzing water-related data to improve efficiency, reduce waste, and support sustainability in operations. It uses IoT sensors, AI/ML algorithms, digital twins, and hydraulic modeling to convert raw measurements into actionable decisions.
What are common challenges when using water data analytics?
Challenges include sensor drift, data quality issues, high startup costs, and cybersecurity risks that must be managed for reliable results. Sensor biofouling, data gaps, concept drift, and interoperability between legacy and modern systems are among the most frequently cited operational hurdles.
What efficiency gains are realistic with modern analytics?
Water data analytics can deliver 15 to 40% water use reductions, substantial energy savings, and lower costs, depending on the project's scope. Benchmarked outcomes include 2 billion liters per year saved at Melbourne Water and 21% energy intensity reduction at NYC DEP.
How do organizations start implementing water data analytics?
Most start with a small-scale pilot, merge multiple data sources, and prioritize building reliable, standardized data frameworks before scaling. A/B testing traditional versus AI control on a contained system is one of the most effective ways to generate credible early evidence before committing to full deployment.